Docs / Capturing Traffic
The Main Window
A three-pane layout: sidebar tree, request list, and detail tabs.
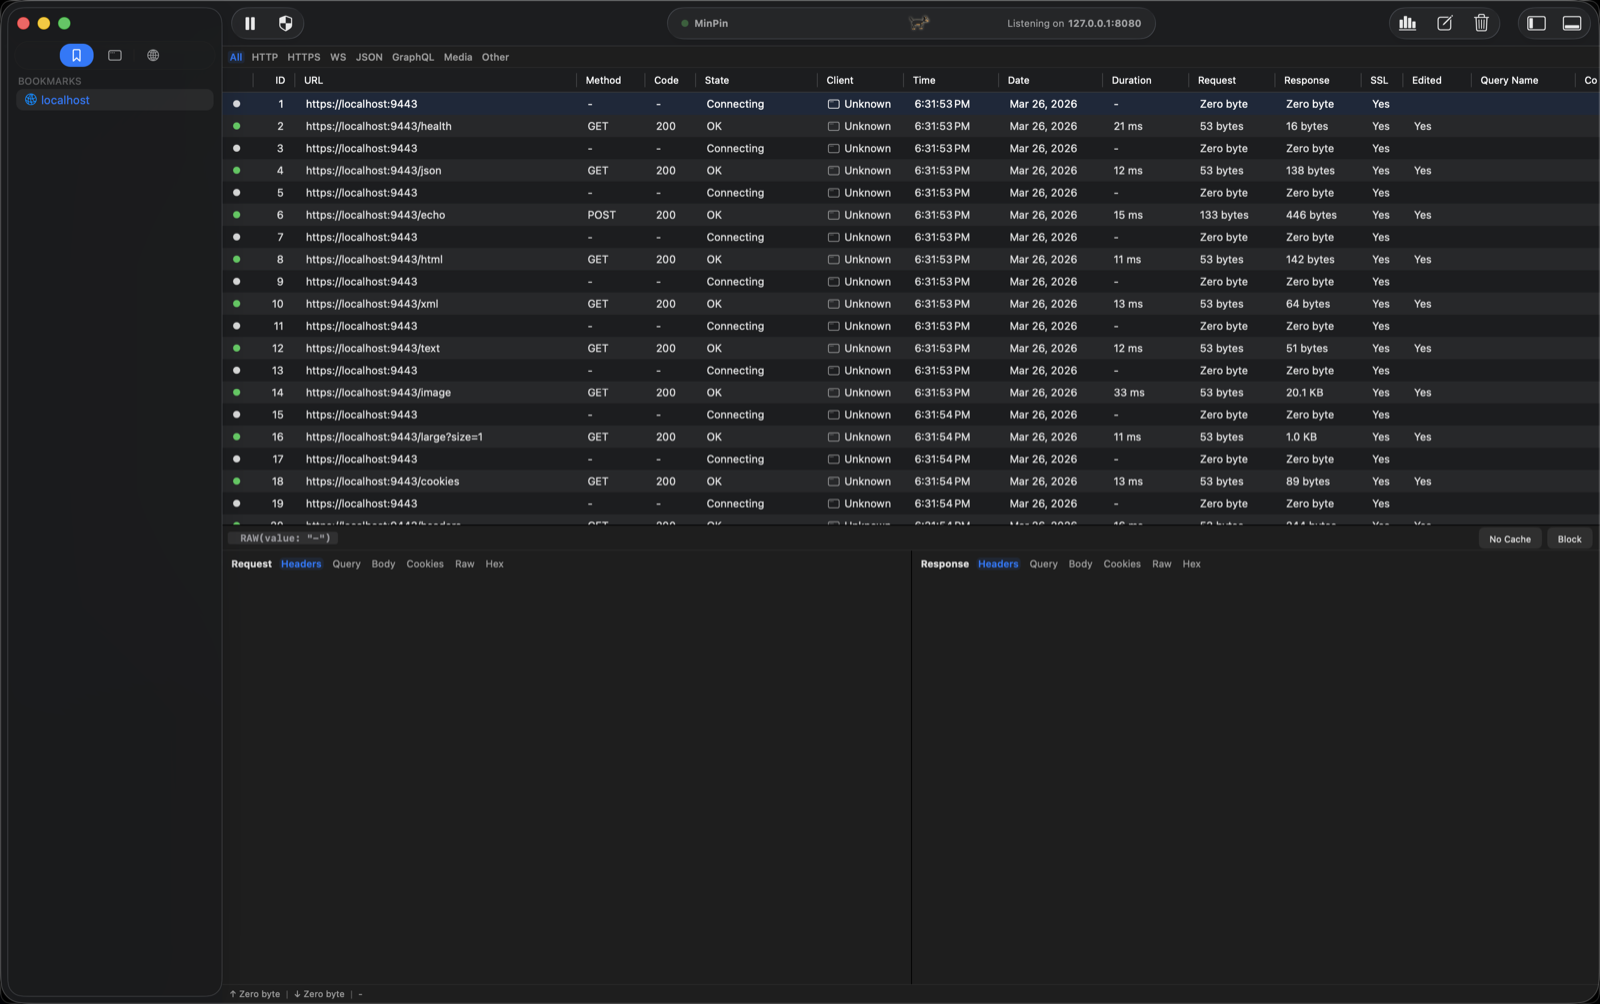
The main window has three panes:
- Sidebar (left) — a tree of captured traffic grouped by Domain or by client App, plus a Pinned tab. See Filtering & Search to narrow it down.
- Request list (center) — every captured request with method, status, client, time, size, and duration columns. Color-coded by status.
- Detail (bottom/right) — the selected request's Summary, Request, Response, and protocol-specific tabs. A summary bar shows method, status, and URL.
Toolbar
Record/pause, clear all, breakpoints, rewrite rules, compose, block-list, and the Security dashboard live in the toolbar. The listening port (127.0.0.1:8080 by default) is shown in the center.
TipDetach the detail view into its own window, or switch the request/response panes between side-by-side and tabbed.